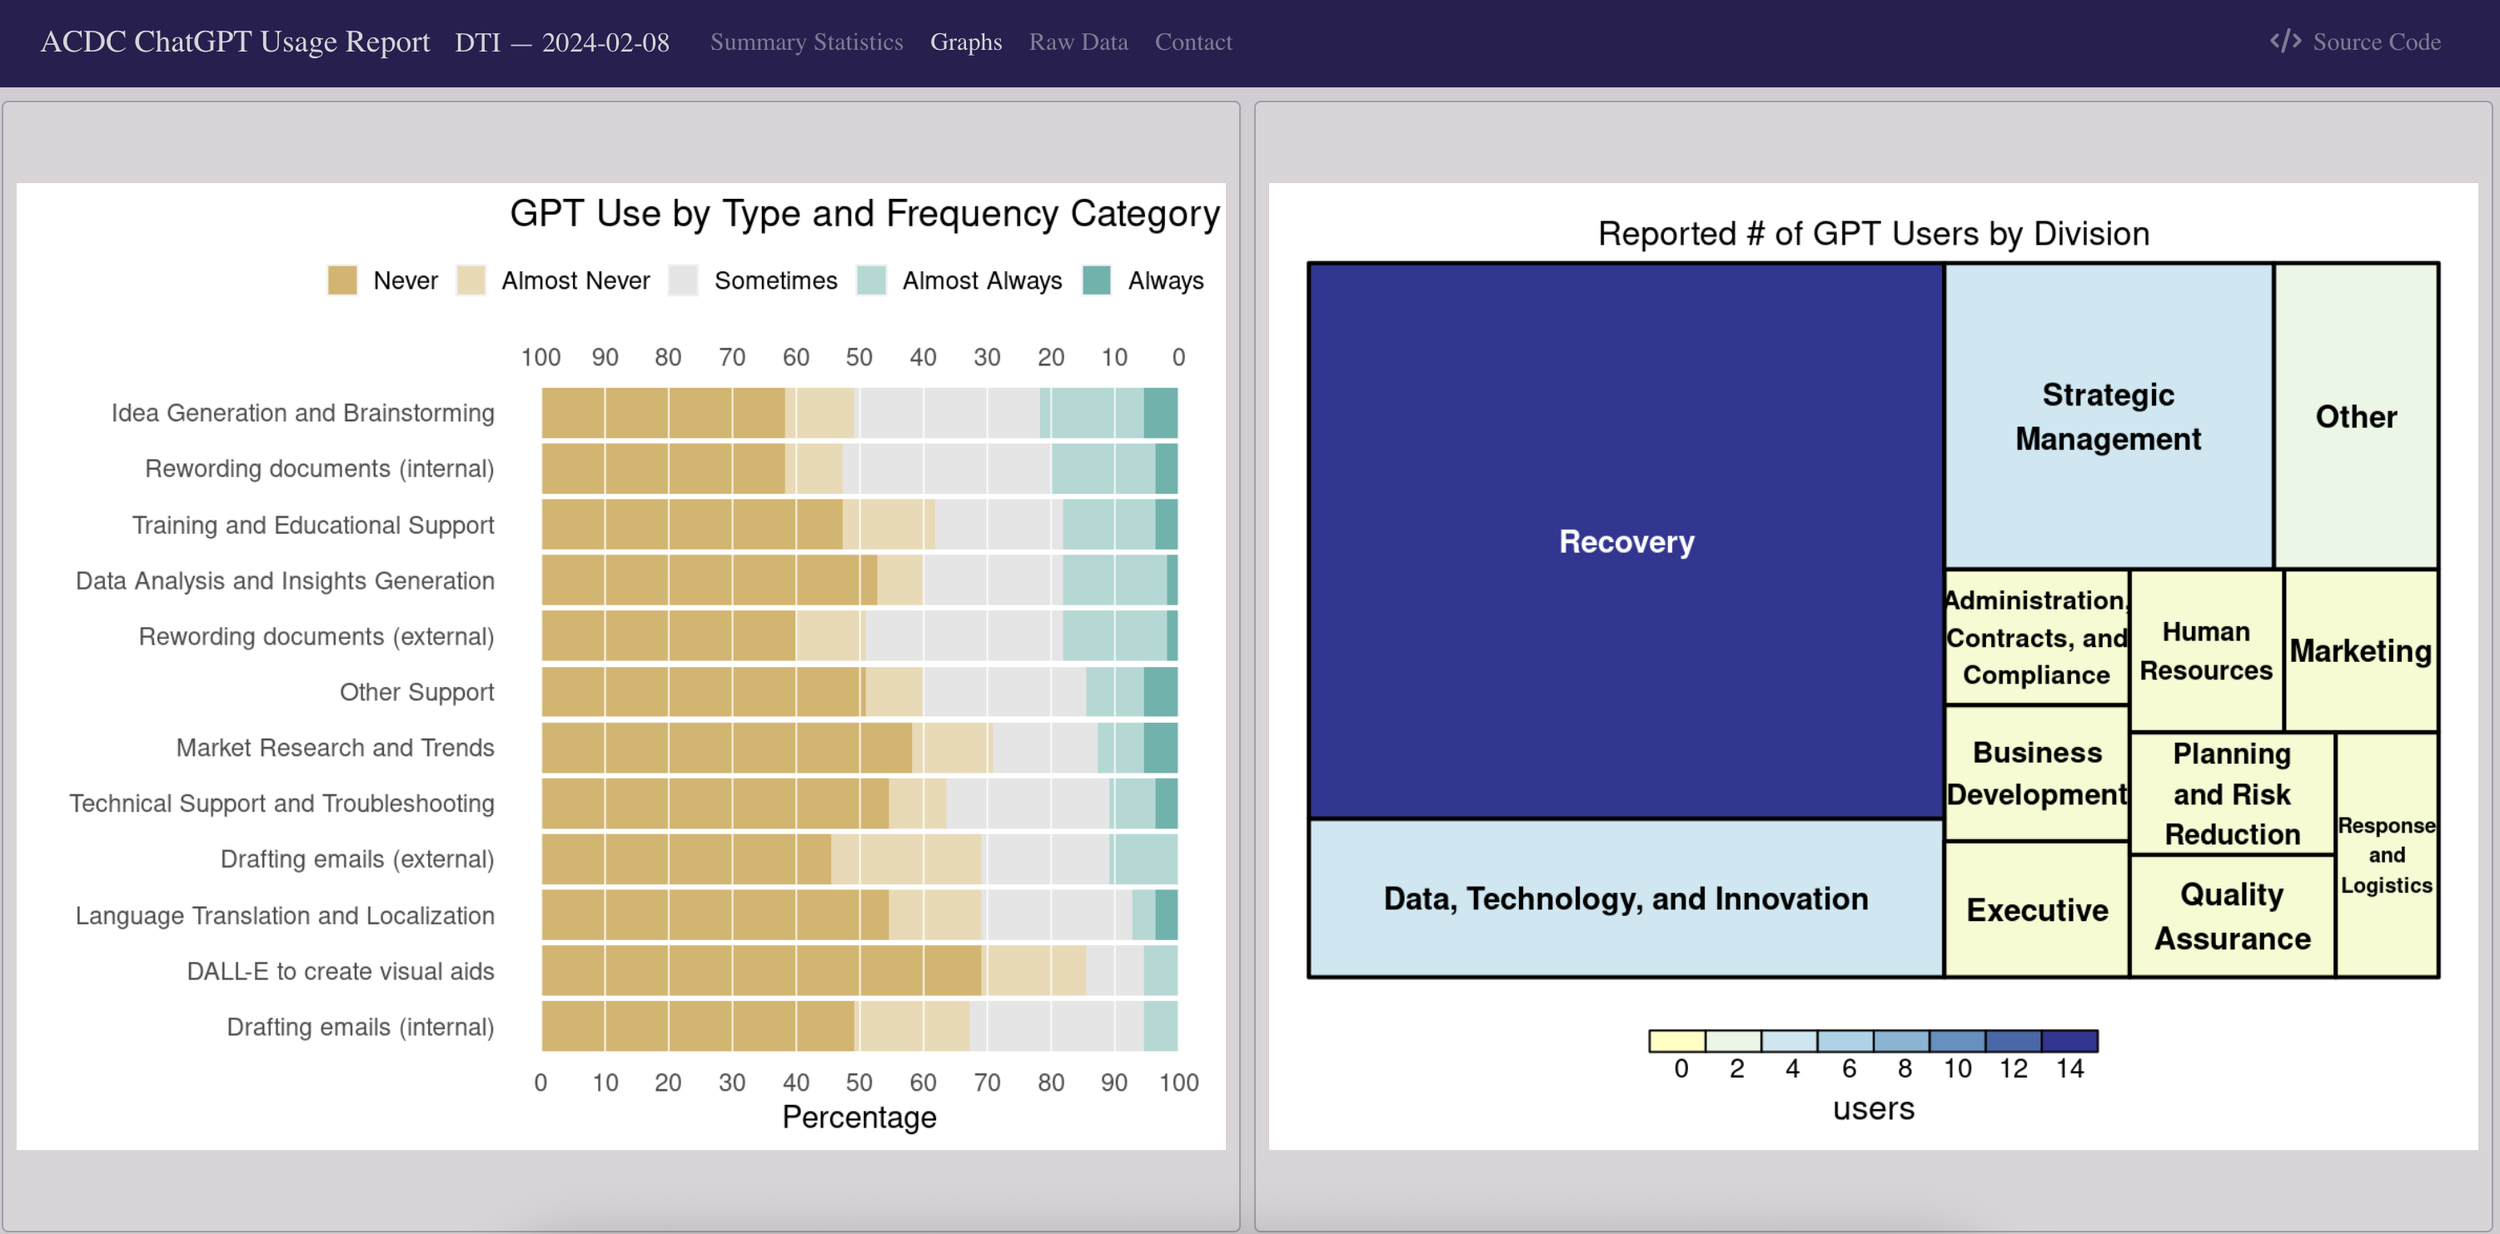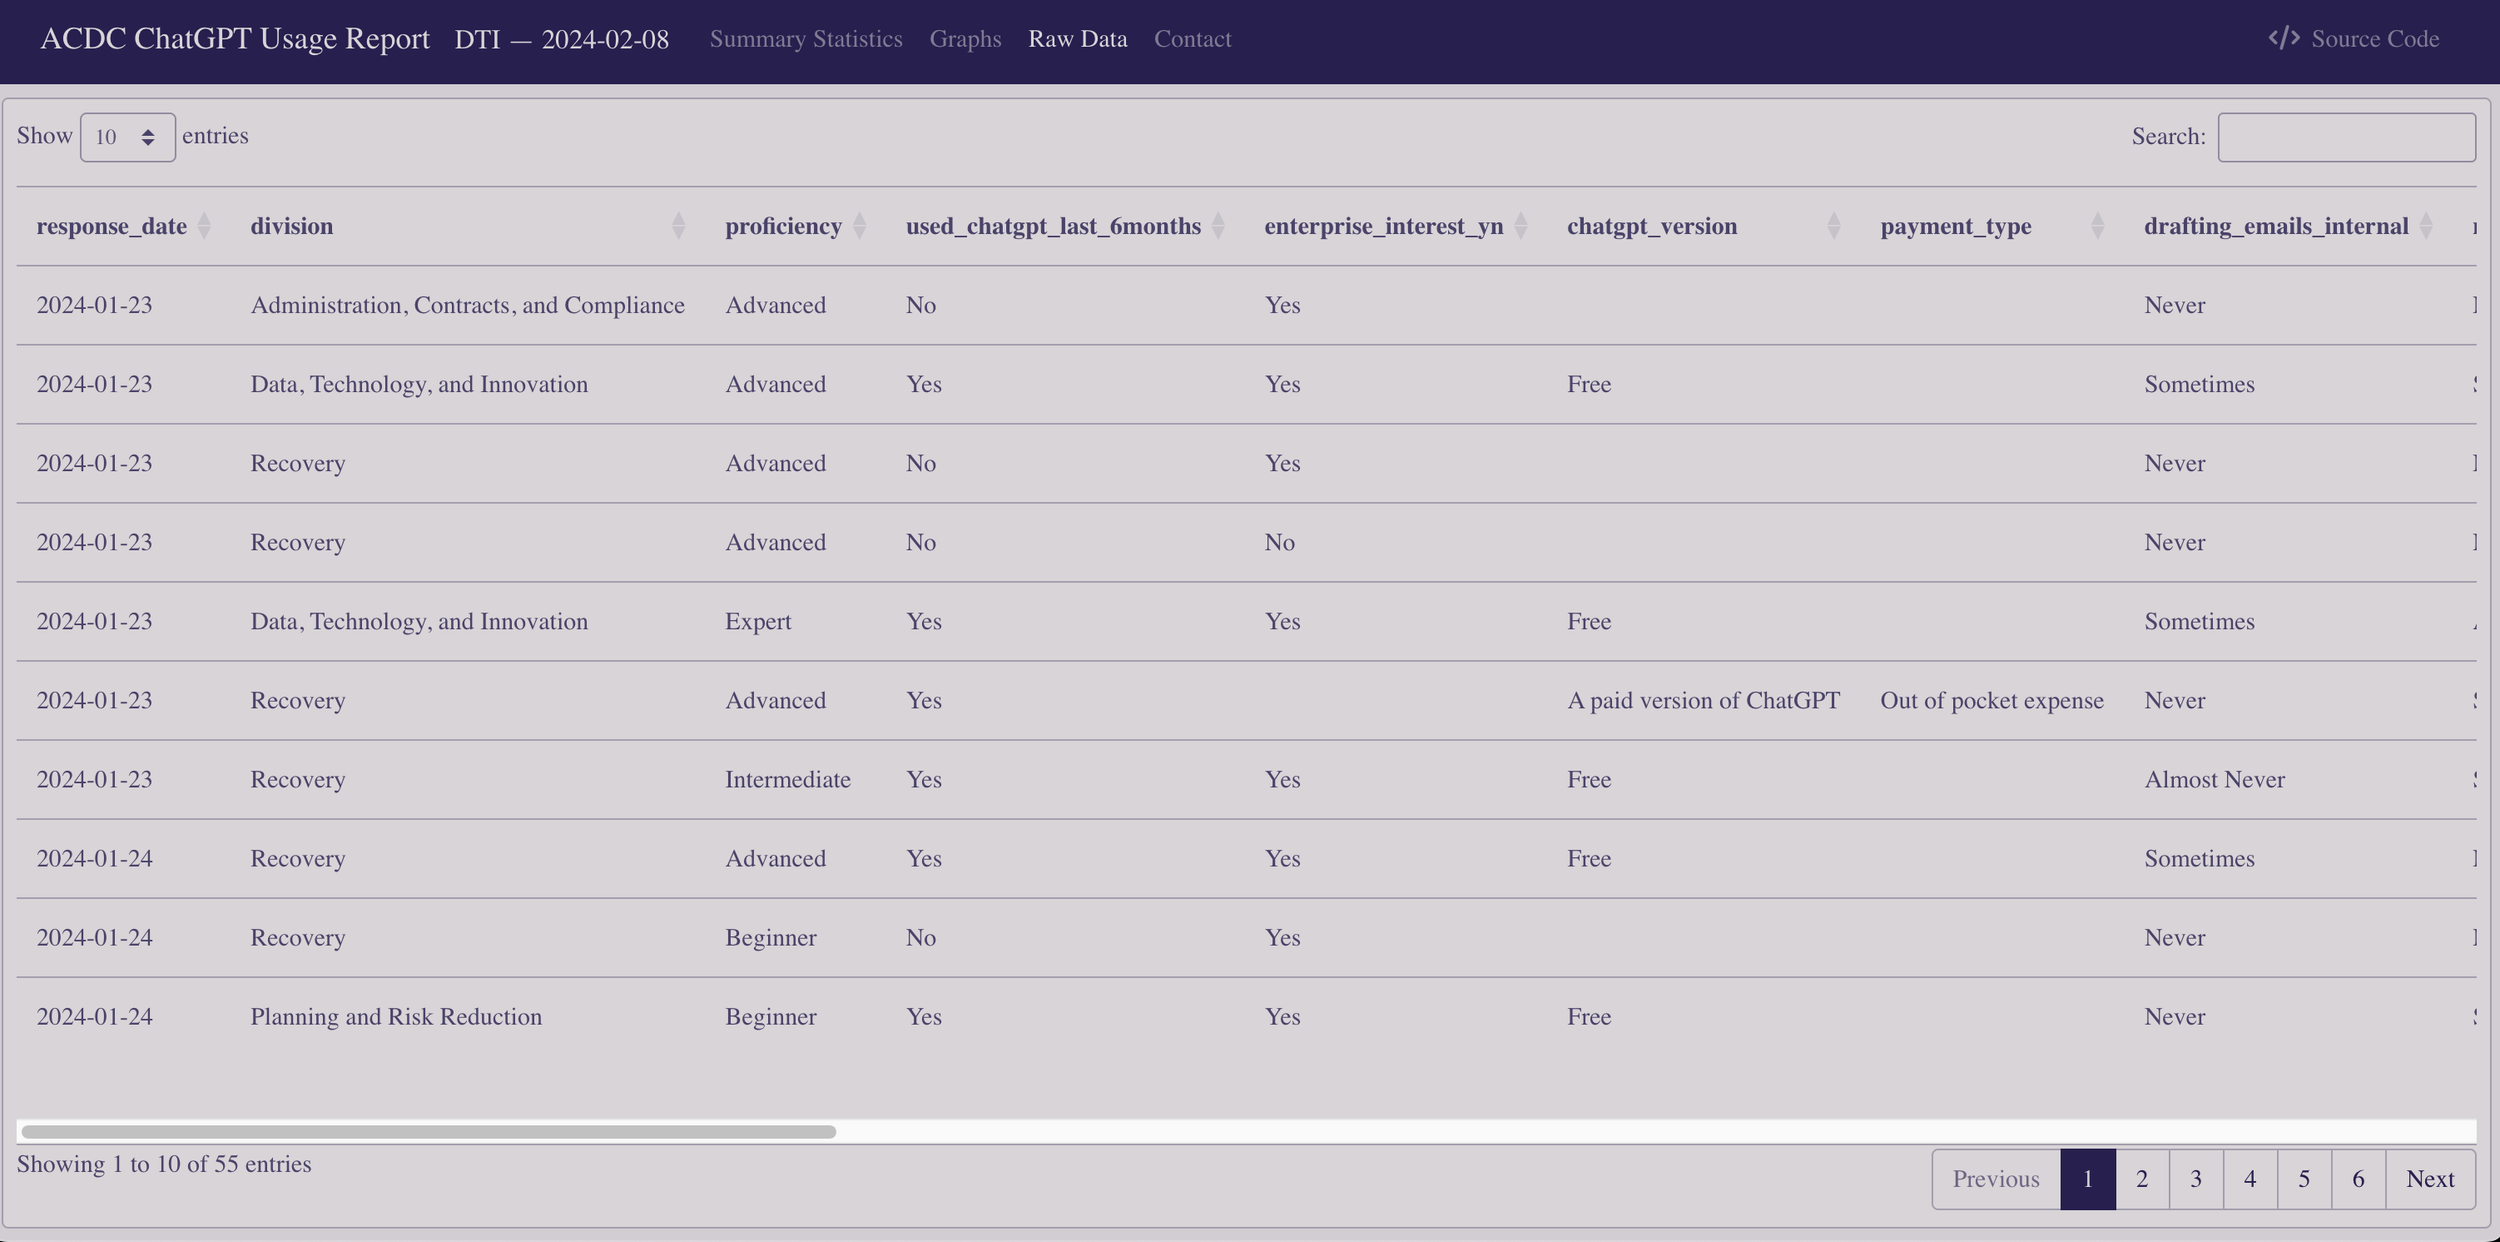
Based on employee survey results about ChatGPT usage, I created a dashboard using R and Shiny to visualize utilization across the organization. An interactive, online version of the dashboard along with its source code can be found here.
Alternatively, static screenshots of the dashboard are displayed below.